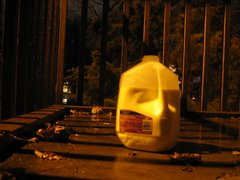
Let's assume we ate every single meal in this apartment (which is not true). 630 meals in 105 days translates to 13.5 ounces of milk per person per meal.
This is an annual milk consumption of 230 gallons (115 per person).
Put simply, we consumed an average of 3.35 ounces of milk per hour, every hour of the day, for three and a half months straight.
This is equivalent to each us being hooked up to a 50cc per hour IV of milk at all times for those three and a half months!

The slope of the regression line was 0.637, which was not far off from the mean consumption of 0.628 gallons per day. This indicates a very steady rate of consumption, though the y-intercept of 1.29 suggests we slowed down. Here are the numbers:
 Purchasing habits:
Mean purchase- 3.47 gallons per trip
Standard deviation- 1.79 gallons
 61.1% of purchases were within 1 standard deviation of the mean purchase size, which is surprisingly normal for so few data points.
 If you want to check our math, and God help you if you do, the spreadsheets are actually accessible in Google Documents at this link.
This has been considerably more work than ever expected. We hope you enjoyed reading as much as we enjoyed drinking.

2 comments:
Now these are statistics that are worthwhile. Who did these, Jeremy or Sanjay?
In fact, we were both responsible for the statistical analysis. Through the magic of Google documents we were able to seamlessly collaborate over the internet (as evidenced by the running chat logged at the bottom of sheet two). Hooray for web2.0!
Post a Comment